When it comes to trading, analyzing volume is crucial for interpreting price movements and market activity. One of the simplest yet highly effective tools for this purpose is the Volume Candles, especially as implemented on TradingView. In this article, we’ll explore what Volume Candles are, how they work, and how traders can use them to improve their strategies.
What Are Volume Candles?
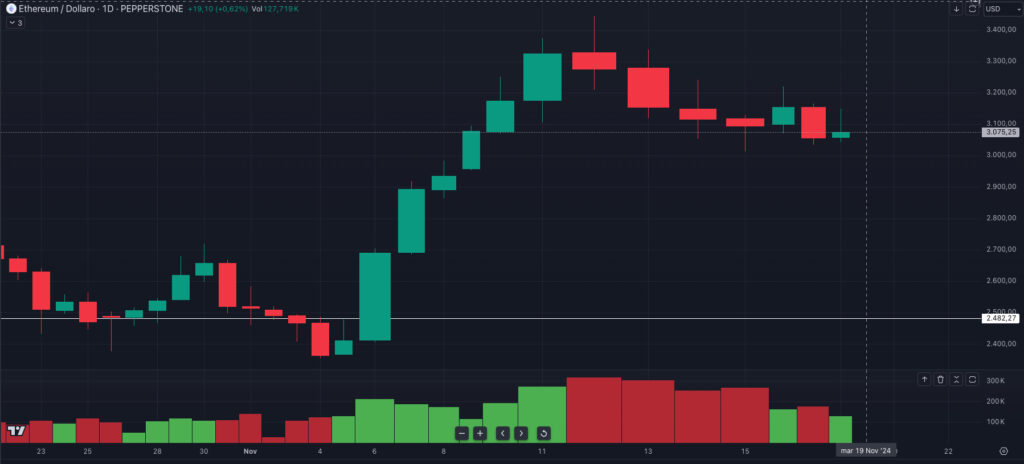
Volume Candles on TradingView are a visual representation of trading activity over a specific time period. Their unique feature is their width, which varies based on the trading volume during that period:
- Wider candles indicate high trading volume, suggesting strong market participation from buyers and sellers.
- Narrower candles signal low trading volume, reflecting reduced market activity.

How to Interpret Volume Candles
Volume Candles provide vital insights into the market’s behavior. Here are some key points to keep in mind:
- Confirming Price Movements:
- A significant price movement accompanied by a wide candle suggests the market supports the move. For example, a breakout above resistance with a wide candle is more reliable.
- Conversely, a price movement with a narrow candle might indicate a lack of interest or a potential false breakout.
- Identifying Key Areas:
- Wide candles often form around critical levels, such as support or resistance zones, or during major news events. These areas attract high interest from institutional traders and large investors.
- Divergence Between Price and Volume:
- If the price rises but the candles narrow, it may signal weakening bullish momentum.
- If the price drops but the candles widen, it indicates strong selling pressure.

Practical Example
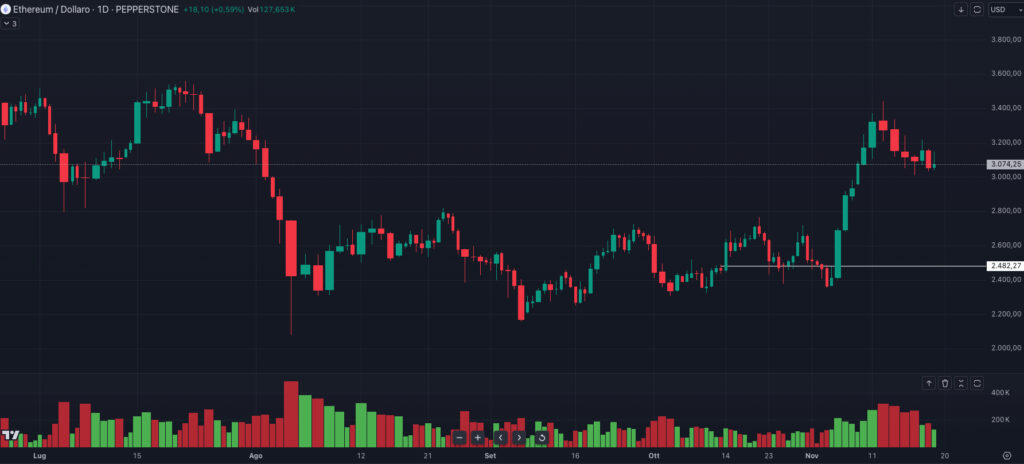
Let’s consider a 4-hour Ethereum chart. During a bullish trend, you notice the Volume Candles widening steadily, signaling increasing participation from buyers. Later, in a consolidation phase, the candles narrow, reflecting reduced activity. This change helps you identify a potential shift in market sentiment.
How to Use Volume Candles in Your Trading Strategy
Volume Candles can be a powerful tool when incorporated into your trading strategy. Here are some practical ways to use them:
- Confirm Breakouts and Breakdowns:
- A breakout with wide candles is a strong signal of genuine market interest.
- A breakout with narrow candles could indicate a false breakout.
- Spot Accumulation or Distribution:
- Narrow candles during a sideways market often indicate accumulation (buying) or distribution (selling) phases.
- Detect Institutional Activity:
- Extremely wide candles during key moments may signal the involvement of institutional investors, who often drive major market moves.
Why Volume Candles Are Important for Traders
The width of Volume Candles provides a straightforward way to assess market participation and validate price action. They can help traders:
- Identify strong trends or weakening momentum.
- Spot high-interest areas in the market.
- Make informed decisions during breakouts, pullbacks, or consolidation phases.
When combined with price action and support/resistance analysis, Volume Candles become an indispensable tool for any trader.
Conclusion
Volume Candles, particularly those on TradingView, are a simple yet powerful visual tool for analyzing trading volume. Their width directly correlates to market activity, making them an excellent indicator of interest and participation. By understanding how to interpret these candles, traders can enhance their decision-making process and gain a significant edge in the market.

 Educational
  November 18, 2024
  6 min.


