XRP has seen an explosive appreciation in recent weeks. The altcoin jumped more than 400% and approached its all-time high (ATH) of $3.31. This strong upward movement has caught the attention of investors, suggesting potential further gains.
However, as it neared its historic peak, an increase in selling pressure put the uptrend at risk. Can XRP still reach a new ATH?
Maintaining support is crucial for driving XRP’s further highs
XRP’s recent surge has taken the crypto market by surprise. Although various altcoins have been recording significant gains, Ripple’s cryptocurrency was still lagging behind.
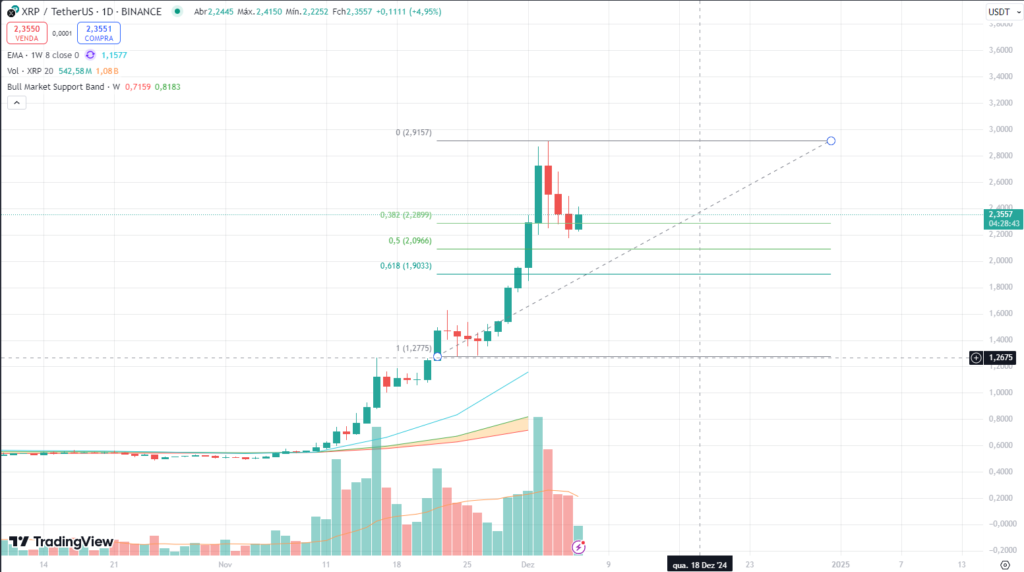
Over the past four weeks, XRP soared by 424%, thus setting its price record for the year. On Tuesday, the altcoin reached a peak of $2.91 but then fell by about 25%.
Currently, XRP is trading at $2.39, showing a recovery of 3% in the last 24 hours.
Following the strong rise, the altcoin fell and is now stabilizing around the 0.382 Fibonacci retracement level at $2.28. This consolidation signals a healthy correction that could propel a new upward movement to test its ATH of $3.31.
Moreover, the 8-period weekly Exponential Moving Average (EMA) is at $1.15, indicating that the overall trend remains bullish in the long term.

However, trading volume has significantly dropped during the correction phase. This weakening suggests that sellers are losing strength. On the other hand, buying power must return to sustain the upward movement.
If the price can break through $2.91 again, there is potential to reach the $3.20 region in the short term. For this to happen, the support at $2.28 needs to be maintained.
If the price loses this support, XRP could test the levels of $2.09 and $1.90, potentially forming a trend reversal.
XRP is currently in a consolidation phase after a significant rally. The region between $2.28 and $2.91 will be crucial in determining whether the price will continue to rise or face further corrections.
Buyers should watch the 0.382 Fibonacci support, while sellers may find opportunities if the price drops below this level.

 News
News  December 7, 2024
  3 min.


