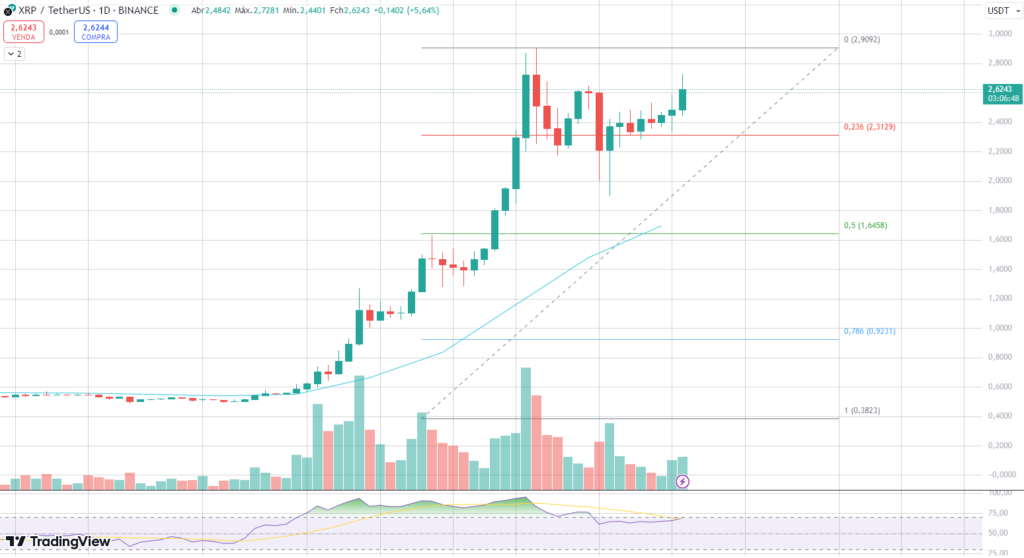
XRP, Ripple’s native token, is consolidating after hitting $2.90. According to on-chain data and technical analysis, the price of XRP is showing mixed signals, combining significant selling flows and strong support levels.
According to the spot market inflow and outflow chart, there was a significant increase in selling in December, reaching critical levels shortly after XRP peaked in price.

However, positive netflow also suggests that selling pressures have been partially absorbed, which has helped to sustain the price above $2.30.
Technical Support and Resistance
Analyzing the daily chart, XRP shows that the price has found resistance at $2.90. This level represents a local top that buyers have not yet managed to overcome. On the other hand, immediate support is at $2.31, which is essential for maintaining the uptrend.

Should sellers increase pressure, XRP could retest the $1.94 zone. On the other hand, a decisive break above $2.90 could propel the altcoin towards the $3.50 region, with an extended upside potential to $3.90 by the end of the month.
On-chain Flow and Trend
On-chain data highlights the impact of token liquidations on the market. Ripple’s recent launch of RLUSD generated speculation of sell-offs by long-term holders, leading to price volatility. The combination of these factors explains the negative flows recorded in the spot market.
However, the positive Netflow observed at key moments reflects the confidence of new buyers in supporting the price levels. This could indicate a balance between supply and demand, signaling a possible recovery.

 Technical Analysis
  December 17, 2024
  3 min.


