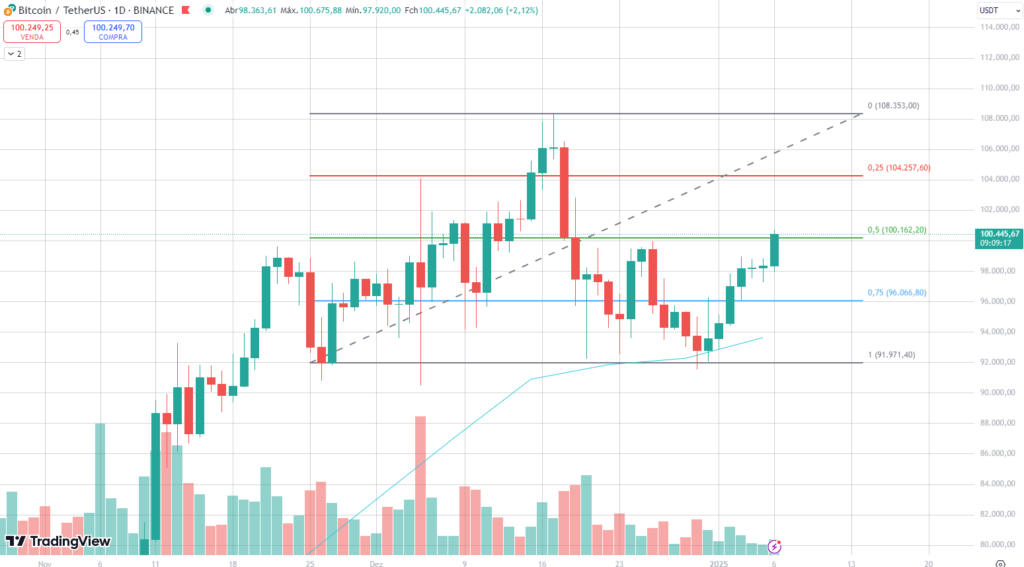
Bitcoin has once again broken through a critical resistance level, trading above $100,000. This movement signals its recovery after testing key support levels. The daily chart reveals that the price has surpassed the 50% Fibonacci retracement level, climbing above $101,000. This indicates a return of bullish momentum, setting the stage for a potential new rally.
If the price remains above $100,000, the market could attract additional liquidity, further strengthening the bullish structure.

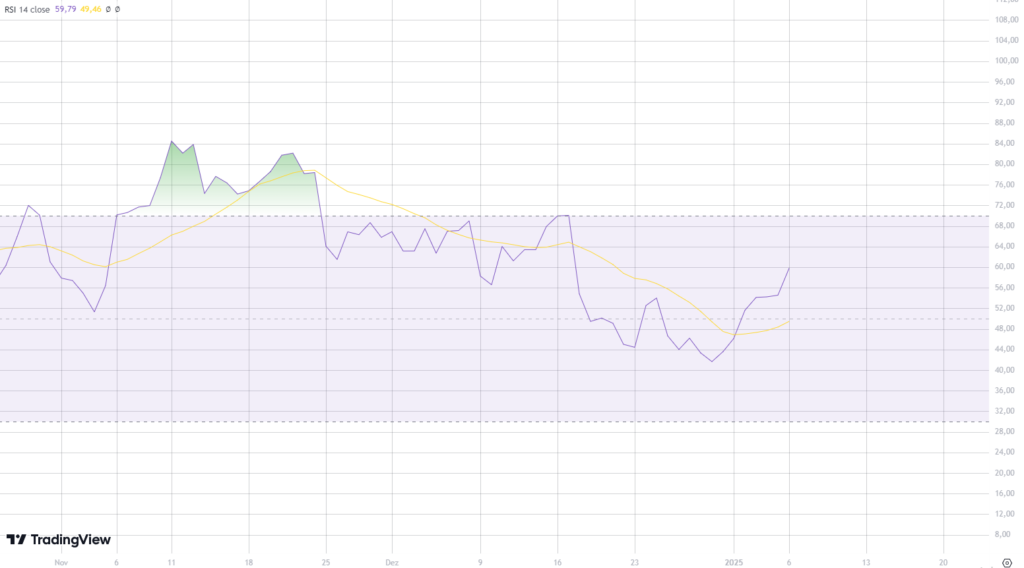
Moreover, the Relative Strength Index (RSI), currently at 59.79, is edging toward overbought territory. This suggests there is still room for the price to rise before any signs of exhaustion appear. The RSI confirms that the bullish momentum remains intact, reinforcing the return of buying pressure. As a result, BTC could see further gains in the short term, driving its price even higher.

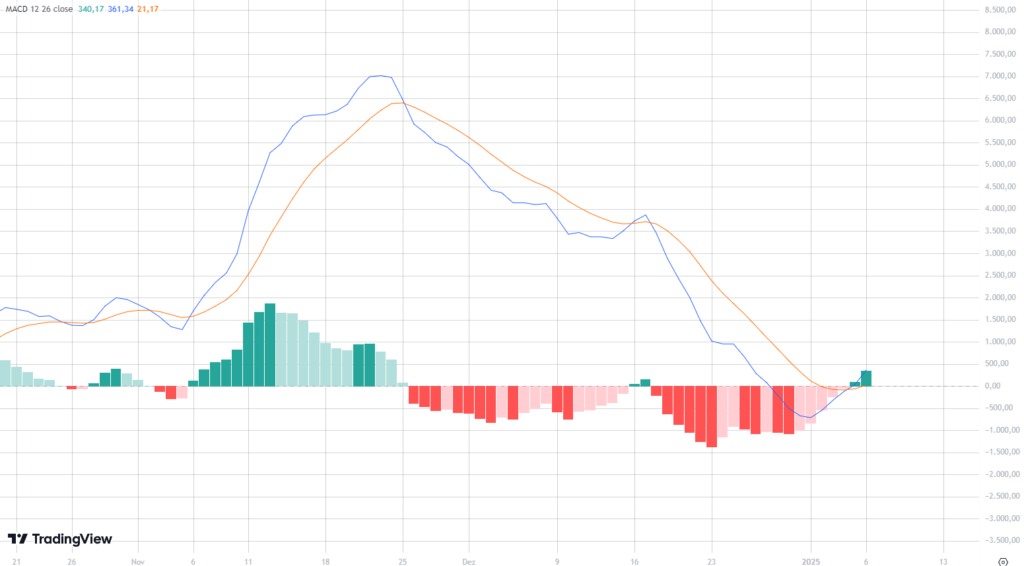
The MACD (Moving Average Convergence Divergence) also shows consistent signs of recovery. The signal lines have just crossed upward, signaling a positive reversal in momentum. Additionally, the MACD histogram is now in positive territory, further confirming the strengthening of buying pressure.

Both the RSI and MACD readings support Bitcoin’s price rally, reinforcing the optimistic short-term outlook. However, if the price fails to hold above $100,000, the market could see profit-taking, potentially pushing the asset back toward support levels around $96,000, which would weigh on Bitcoin’s price.
The consistency of trading volume will be a crucial factor in determining whether this recent resistance breakout consolidates into support or if the market enters a new phase of sideways movement.

 Technical Analysis
  January 6, 2025
  3 min.


