In trading, every price level tells a story. One of the most intriguing dynamics to observe is that of volume gaps—areas on a chart where trading volume is significantly lower compared to others. These gaps are not random; they are key zones that can play a crucial role in understanding market behavior.
What Are Volume Gaps?
A volume gap occurs when trading volume at a specific price level is noticeably lower than surrounding areas. These gaps can be easily identified using tools like the Volume Profile, which displays trading volume distributed along price levels rather than time.

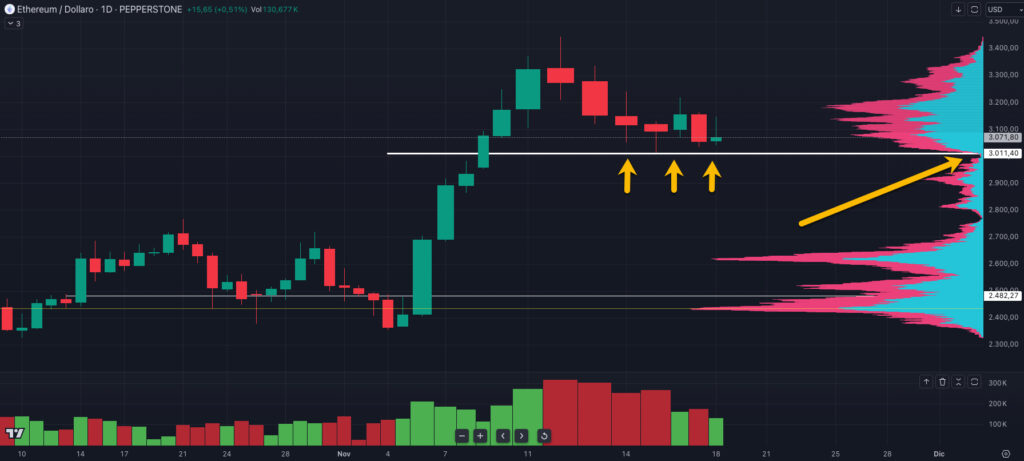
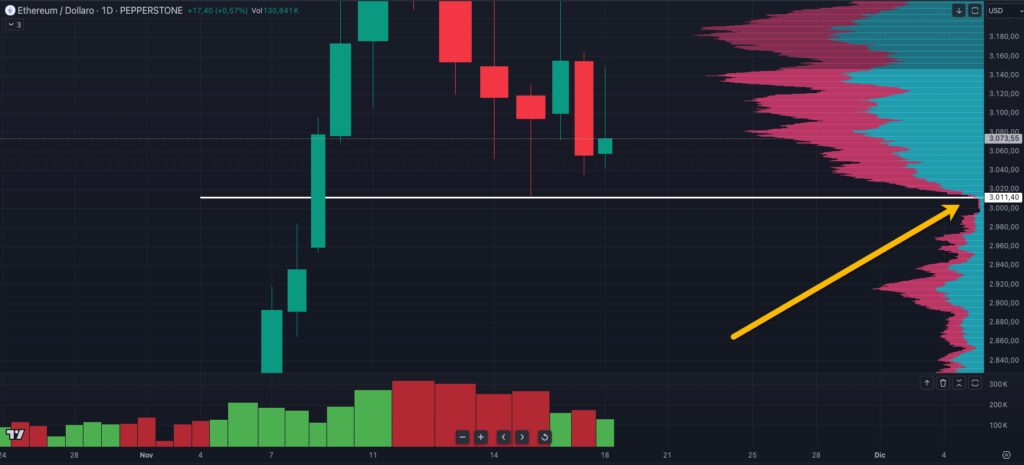
In the image, you can see a volume gap around the $3,011 level on Ethereum’s chart. This area, highlighted by the yellow arrow, represents a zone where price moved quickly with little trading activity. These gaps indicate low interest from traders at these price levels but can later act as key zones for future price reactions.
Why Are Volume Gaps Important?
When price approaches a volume gap, market dynamics can shift significantly. Volume gaps often serve two important roles:
- Price Accelerators: When price enters a volume gap, it tends to move quickly through the area until reaching the next high-volume zone. This happens because there are fewer orders in these areas, providing less resistance or support.
- Support or Resistance Zones: Volume gaps can also act as psychological barriers, where price struggles to break through without a significant change in momentum.
The volume gap at $3,011 acted as a support level. When price tested this level for the first time, it rebounded sharply, showing how even a single test of a volume gap can significantly influence market direction.
How Volume Gaps Act as Support and Resistance
Support
When price approaches a volume gap from above, it often acts as a support level. Traders see these zones as opportunities to buy, believing the price is unlikely to fall further without significant momentum.

In the image, the $3,011 level acted as a support during a single test. Price reacted positively, bouncing back upward after touching the gap. This demonstrates how volume gaps can serve as temporary “floors” for the market.
Resistance
Conversely, when price approaches a volume gap from below, it can act as resistance. In these cases, the market often consolidates or reverses direction before attempting to break through.
How to Use Volume Gaps in Your Trading Strategy
Volume gaps can be a valuable tool for identifying key levels and planning your trades. Here’s how to use them effectively:
- Identify Volume Gaps: Use the Volume Profile to spot areas with noticeably low trading volume. These zones often appear as “holes” or thin areas in the profile compared to surrounding levels.
- Monitor Price Behavior: Observe how price reacts when approaching a volume gap. A sharp bounce or rapid movement through the gap can provide valuable insights into market strength and sentiment.
- Set Entry and Exit Points: Use volume gaps to place stop-loss and take-profit orders. For example, if price is above a gap, you can set a stop-loss just below it, anticipating a potential acceleration if the gap is breached.
Real-World Example: Ethereum and the $3,011 Gap
In the charts provided, the $3,011 volume gap on Ethereum served as a support level during a single test. After reaching this zone, the price rebounded sharply, highlighting how even one interaction with a volume gap can lead to a significant market reaction.
If price revisits this area and breaks below $3,011, it’s likely to accelerate downwards to the next high-volume zone, visible on the Volume Profile near $2,482. This scenario underscores how volume gaps can act as both support and resistance, as well as acceleration points for future price movements.
Conclusion
Volume gaps are a powerful tool for understanding market behavior in cryptocurrency trading. In Ethereum’s case, the $3,011 level demonstrates how these zones can act as support or resistance, shaping the market’s direction. By identifying and leveraging volume gaps in your trading strategy, you can make more informed and confident decisions. Integrate this technique into your analysis and see how it enhances your market insights!


