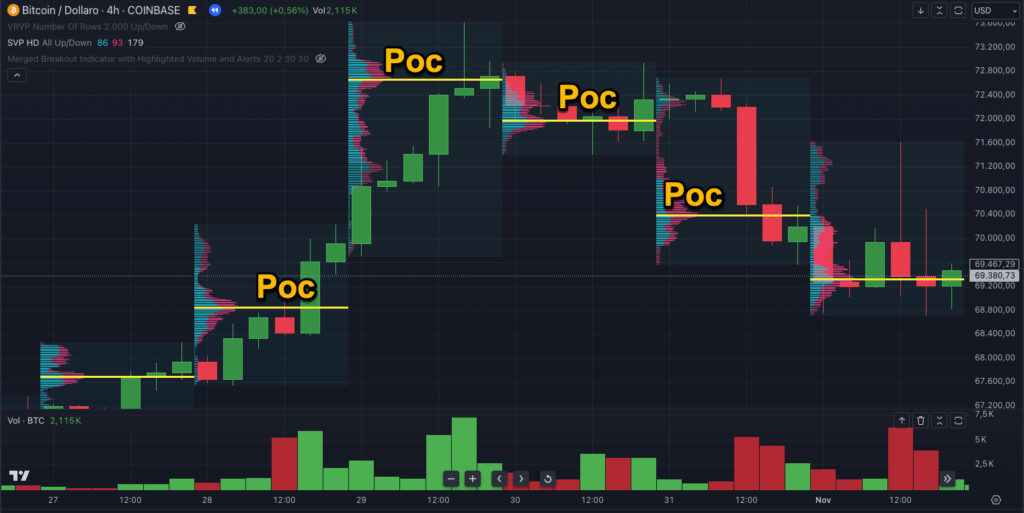
This tutorial will guide you through analyzing a trend shift from bearish to bullish using the concept of POC (Point of Control) shift, which acts as a type of “volumetric engulfing.”

Yellow Line = Point of Control.
1. Understanding the POC Concept
• The Point of Control (POC) is the price level where the highest trading volume occurred within a given time frame.
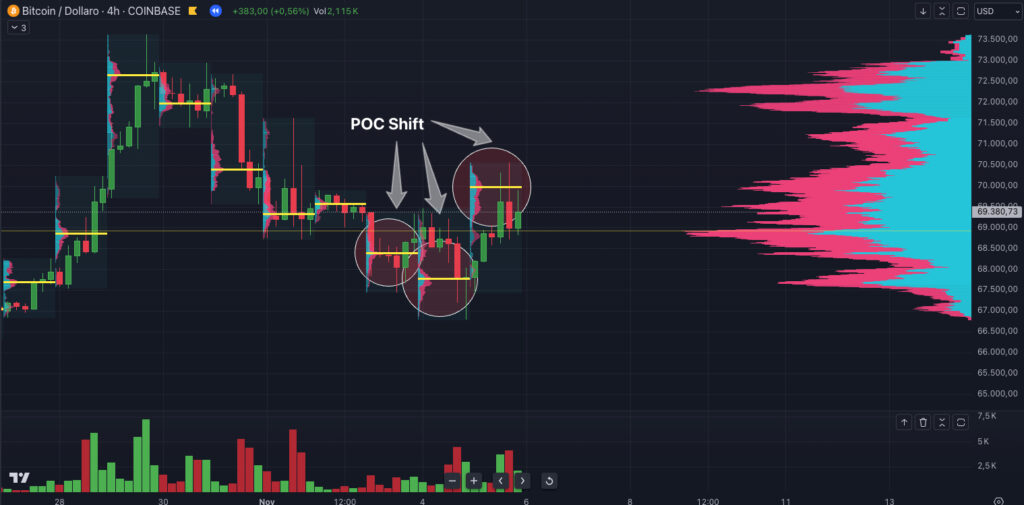
• A POC shift occurs when the level with the most traded volume moves significantly, signaling a potential change in market structure.
• This concept can be leveraged to identify possible trend reversals.
2. Observing the Bearish Context
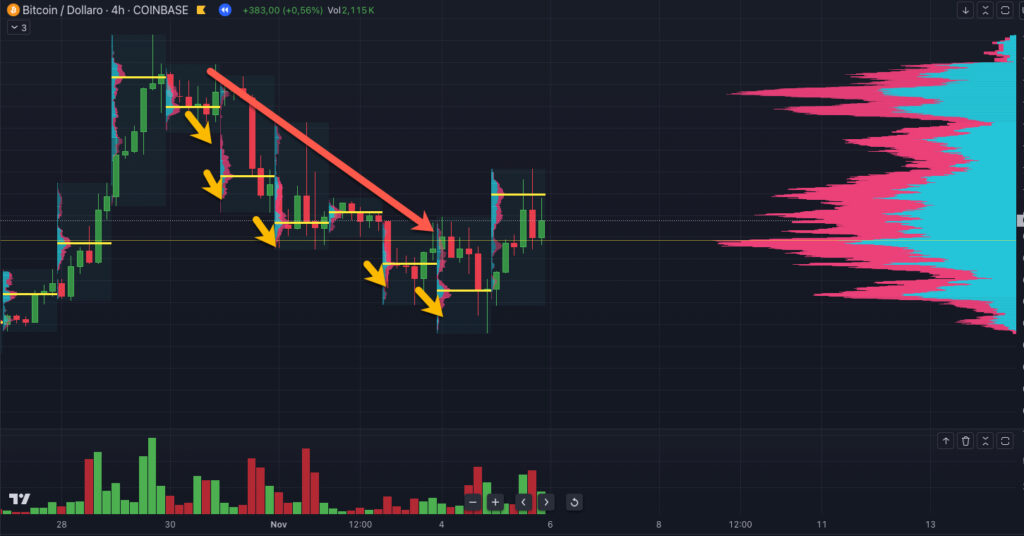
In the first chart, we can observe an initial bearish structure:
• Bearish Segment: POCs tend to shift downward as the price declines.
• Bearish Confirmation: Volume is concentrated at lower levels, indicating that sellers are in control.

➡️ Key Points to Note:
• Bearish candles are accompanied by consolidated volumes at lower price levels.
• Failure to break above key levels suggests that selling pressure remains strong.
3. Spotting the Structural Shift
In the middle section of the chart, we see the first signs of a trend shift:
1. POC Shifting Upwards: New POCs progressively move higher compared to previous ones.
2. Increased Volume at Higher Levels: Buyers begin to enter the market, shifting the balance between supply and demand.
3. Volumetric Engulfing: In this phase, significant volumes are seen on bullish candles, often outpacing the previous bearish candles.
➡️ Visual Evidence in the Chart:
• Circles highlight the POC shifts, with arrows pointing to the upward movement.
• Price levels previously rejected become areas of support.
4. Confirming the Bullish Trend

In the second chart, we can see the transition is complete:
• Definitive POC Shift: The POC moves consistently to higher levels, signaling a clear trend reversal.
• Breaking Local Resistance: Price breaks through key levels with strength, turning them into support.
• Bullish Consolidation: After the breakout, the market consolidates above new POC levels, confirming the beginning of a bullish structure.
➡️ Key Points to Monitor:
• Increasing Volume: Higher volume supports the interest of buyers.
• Reactions to Previous POCs: Observe how price respects old POCs as either support or resistance, depending on the trend direction.

5. Practical Application
To apply this analysis:
1. Set Up the Volume Profile on Your Chart: Identify POCs and monitor their movements.
2. Observe Key Levels: Trend shifts often occur near areas of strong support or resistance.
3. Confirm with Volume: Volume must confirm the POC shift; look for areas where volumes increase significantly.
➡️ Trade Decision:
• Once a POC shift is identified with volume confirmation, consider entering a trade in the direction of the new trend.
• Place your stop loss below the previous POC to manage risk effectively.
Conclusion
The shift in POC is a powerful signal of market structure change. As demonstrated in the charts, the transition from bearish to bullish can be identified by observing POC movements and analyzing volume patterns. Following these steps can enhance your ability to identify and capitalize on market reversals.


