Bitcoin (BTC) is nearing a critical resistance level, with its price trading around $105,000. The daily chart suggests a potential battle between buyers and sellers, while the liquidation heatmap highlights critical levels that could trigger sharp market movements.
This analysis delves into the technical levels and implications of the current liquidation scenario for Bitcoin’s price.
Bitcoin Struggles to Hold Support at $105,000
BTC maintains a bullish structure on the daily chart, with the price respecting the weekly 8-EMA, currently at $95,493. The main support lies at the $100,000 region, while the key resistance zone is between $108,000 and $109,000. These areas (red line) mark the two most recent peaks, which faced strong rejection.
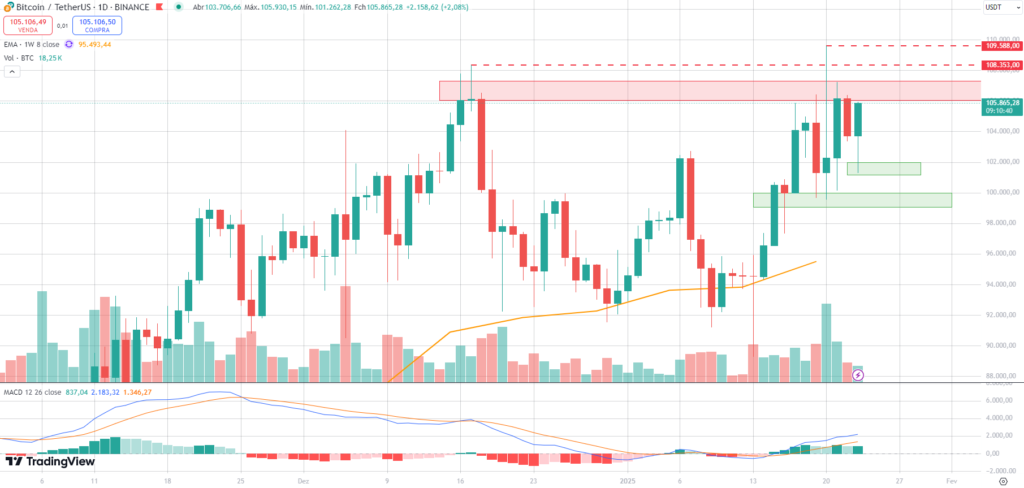
Indicators like the RSI, sitting at 60, point to a slight increase in bullish momentum, though not yet at overbought levels. Meanwhile, Bitcoin’s MACD shows a bullish crossover, signaling that buying momentum could strengthen further, especially if BTC breaks above resistance.
Trading volume, although moderate, has shown an uptick in recent days, signaling renewed interest from traders. Breaking through the $108,000 zone could pave the way for a test of $110,000. Conversely, if BTC is rejected at this level, it may revisit the $100,000 region.
Sideways Movement Likely Until FOMC Announcement
The liquidation heatmap reveals that over the past 24 hours, more than $90 million in Bitcoin positions were liquidated. The most critical zones ranged between $104,000 and $108,000, with the highest concentration of liquidations in short positions.
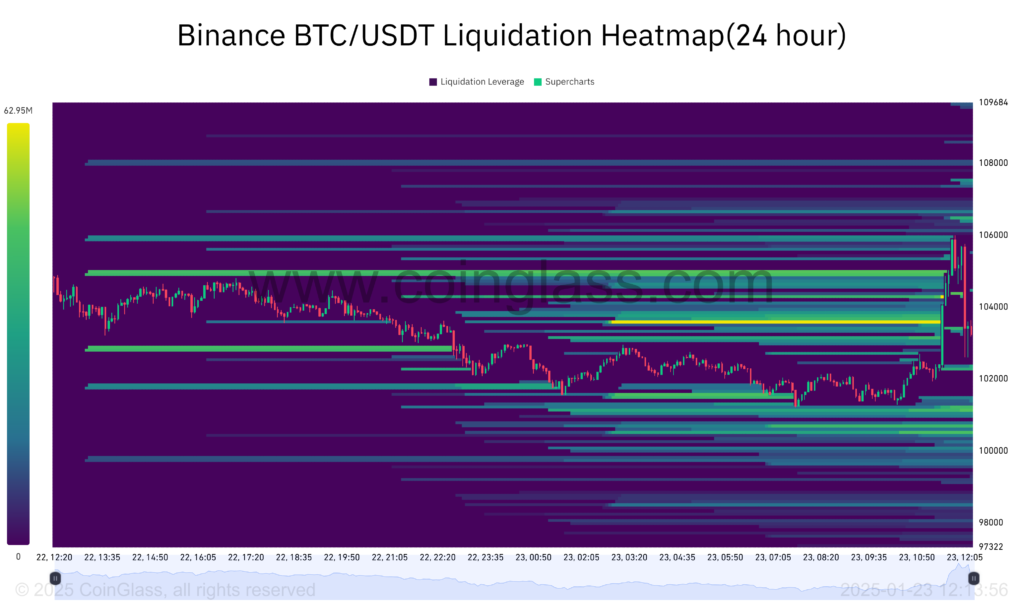
However, the heatmap also shows significant levels of long liquidations at $100,000, reinforcing this support as a crucial point. Any movement below this level could trigger additional selling pressure, leading to a steeper decline.
Some analysts believe Bitcoin will remain in this price range until the upcoming FOMC meeting on January 28–29. As the market expects interest rates to stay between 4.25% and 4.5%, analysts are projecting another downturn for BTC. However, any dovish signal or the start of monetary easing (QE) could spark a new bullish move.
BTC Price Projection
Bitcoin is at a pivotal moment. Breaking the $108,000 resistance could open the door to a run toward $110,000 or higher, particularly with the liquidation of short positions. On the other hand, losing the $100,000 support could see the asset revisit lower levels, such as $95,000 or even $90,000.