Bitcoin Today: The price of the leading cryptocurrency started the day on a bullish note. Let’s explore what might be driving Bitcoin’s price surge and what to expect in the coming hours or days.
Bitcoin Today: How Is Bitcoin’s Price on February 10?
On the daily Bitcoin price chart, a recovery movement can be observed following a recent dip. The asset is currently trading around $97,500, testing a key resistance level near $98,000. Immediate support is found around $95,000, with a noticeable increase in trading volume during attempts to break through this level.
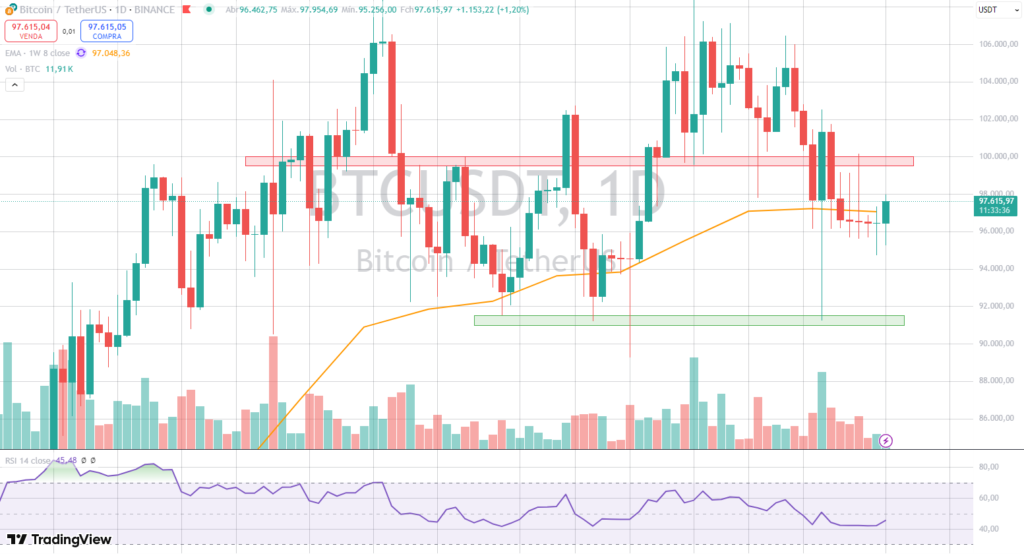
The Bitcoin RSI indicator on the daily chart signals a gradual rise in buying pressure. Although still below the 50 line, this could indicate a healthy consolidation period before a more sustained bullish movement. Additionally, the 8-week EMA remains a crucial dynamic support, reinforcing price stability. This suggests that Bitcoin’s price may demonstrate resilience and hold above this level.
Bitcoin Price Could Resume an Uptrend in the Short Term
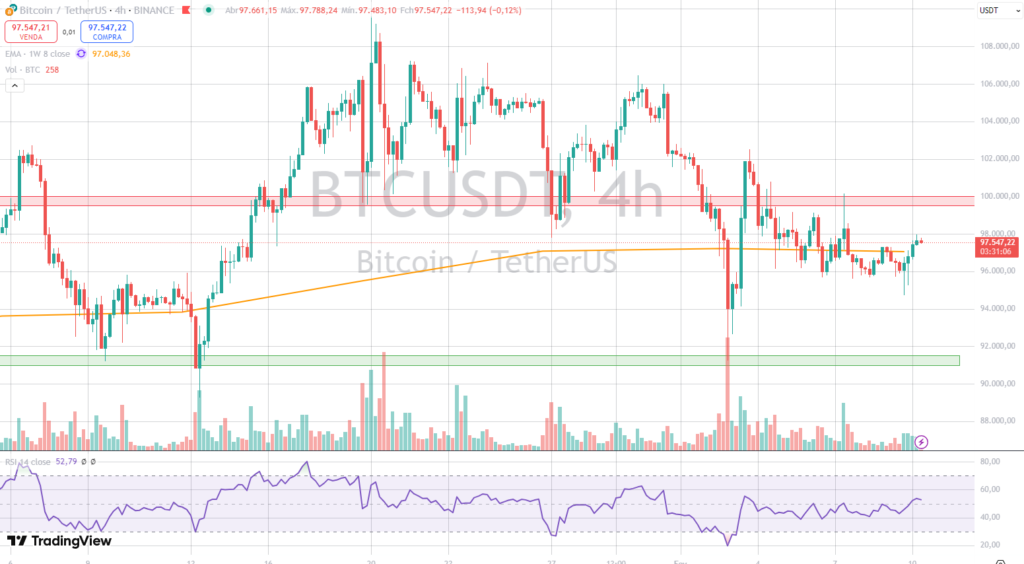
On the 4-hour chart, Bitcoin’s price is experiencing slight consolidation following a bullish attempt. The price is currently in the middle of a sideways channel, defined by resistance at $98,000 and support at $96,000.
Which is the best exchange to buy your first cryptocurrencies, OKX vs Binance? Find out here.
An upward trendline drawn from the most recent low continues to support buying momentum, while the RSI indicates neutral relative strength near the 50 line. This reinforces the idea of a balance between supply and demand within this timeframe.
Based on the two analyzed charts, Bitcoin’s price today is at a critical juncture. If it successfully breaks above the immediate resistance at $98,000, further gains could follow. Otherwise, a slight pullback could see Bitcoin testing support at $96,000, with a potential stabilization around $95,000. The overall trend remains uncertain, with signs of indecision in both observed timefram