Ethereum’s price is showing signs of recovery after a sharp correction. On Tuesday (11th), ETH is attempting to sustain a moderate uptrend, encountering resistance at a key level that could define its next major move. The market is closely watching whether the asset has the strength to break this barrier or if another pullback is imminent.
Ethereum Attempts Breakout After Weeks of Price Decline
On the daily chart, Ethereum is trying to recover from the strong downtrend seen in recent days. The support zone around $2,400 has shown strength, attracting buyers and pushing the price higher. Currently, ETH is approaching the $2,780 region, which coincides with the 50% Fibonacci retracement level—a historically significant point where price may find resistance or support before establishing a new trend.
🔍 Understanding Fibonacci Levels: The Fibonacci retracement tool is widely used in technical analysis to identify potential support and resistance zones based on mathematical ratios. The 50% level is one of the most closely watched by traders.
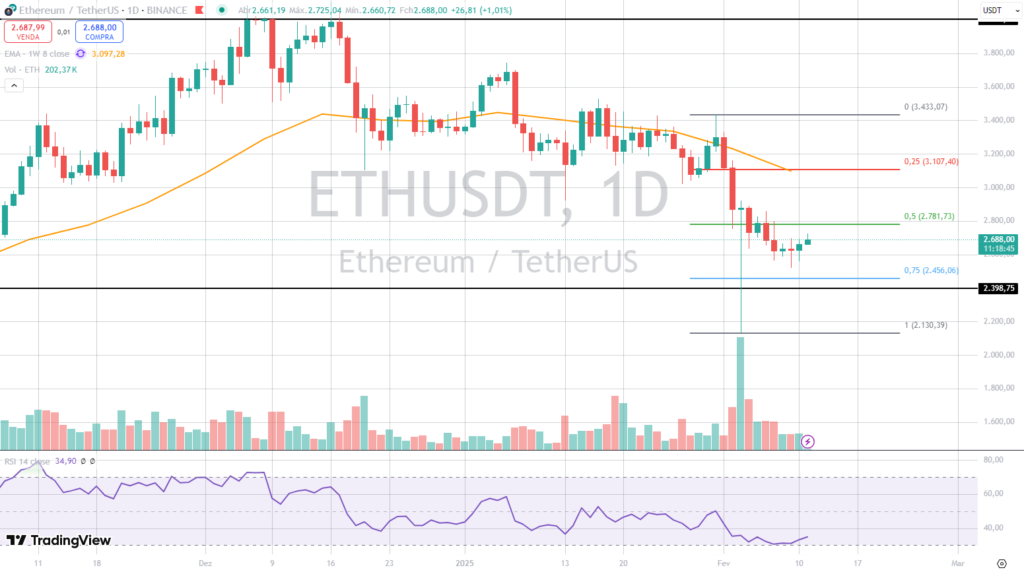
The Relative Strength Index (RSI) stands at 34.90, indicating that the asset is emerging from oversold territory. This suggests that, although Ethereum remains in a bearish trend, there is room for a short-term recovery, at least until the RSI reaches the 50 level, which signals a balance between buyers and sellers.
🔍 Understanding RSI: The Relative Strength Index (RSI) measures the speed and magnitude of price movements on a scale of 0 to 100. When below 30, an asset is considered oversold (potentially undervalued), and when above 70, it is overbought (potentially overvalued).
Ethereum’s Short-Term Consolidation Hints at Potential Price Growth
On the 4-hour chart, Ethereum remains consolidated within a sideways channel, fluctuating between $2,600 and $2,780. This movement suggests indecision between buyers and sellers but could also indicate an upcoming major price move.
The resistance zone around $2,900 is the main barrier that must be surpassed to confirm a stronger bullish trend. However, trading volume has shown a slight increase, hinting that volatility may rise in the coming days.
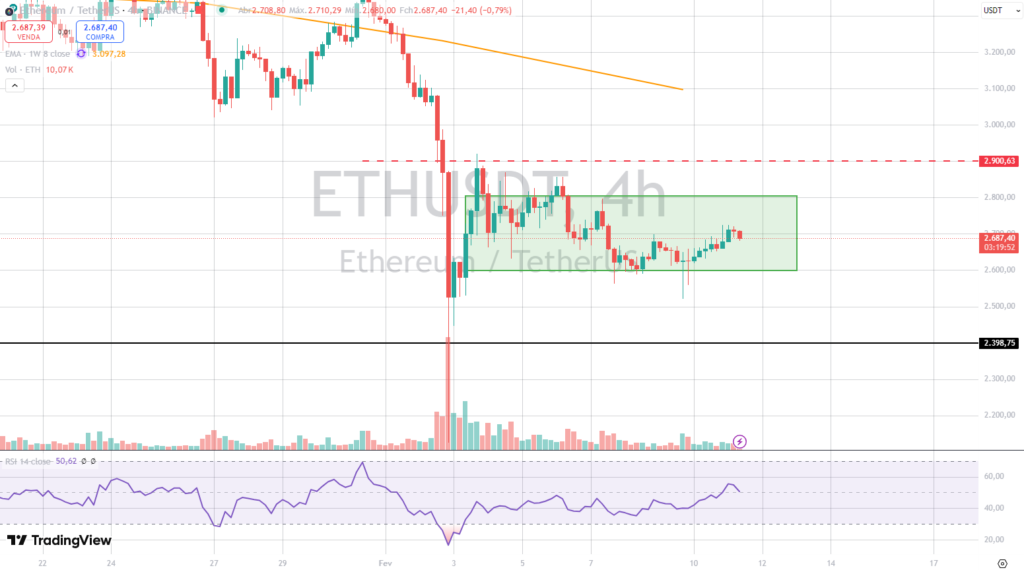
If the price breaks out of this range with strong momentum, Ethereum could quickly target higher levels. On the other hand, if ETH fails to hold its current support, another correction to $2,400 may occur before a stronger recovery attempt.
- OKX vs Binance? Find out which is the best exchange to buy Ethereum.
Ethereum Price Outlook: Can ETH Break Resistance?
Ethereum is at a pivotal moment, with a critical price decision expected in the coming days. If buyers manage to push the price above $2,780, ETH is likely to test the $2,900 resistance and potentially resume a stronger uptrend.
Conversely, failure to break this barrier could result in a new retracement, retesting the $2,400 support zone.
The market remains focused on Bitcoin’s (BTC) performance and overall investor sentiment, as these factors heavily influence Ethereum’s price action. The next move will be crucial in determining whether ETH can regain its bullish momentum or face another wave of sell-offs.