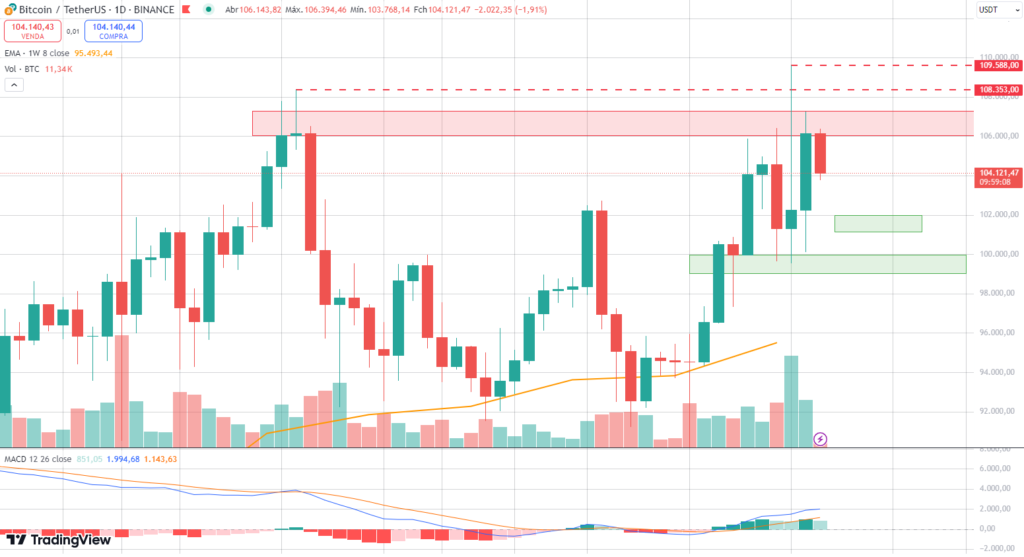
Bitcoin’s (BTC) price is trading slightly lower this Wednesday (22). Recently, the asset faced strong selling pressure in the $108,353 and $109,588 range, marking local tops. However, another resistance level must still be overcome before retesting higher regions. Check out the analysis for BTC’s next potential moves.
Bitcoin Price Must Break $106K Resistance Before Retesting ATH
The daily Bitcoin chart shows the asset encountered significant resistance in the $108K to $109,500 range, highlighted as the rejection zone at the top of the chart. Currently, BTC is trading at $104,121.47, reflecting a 1.91% drop. This pullback follows a recent rally that pushed the asset above the psychological $100K resistance, suggesting profit-taking by investors.

The RSI (Relative Strength Index) indicator remains in the upper neutral zone at 60, indicating that the asset has not yet reached overbought levels. However, bullish momentum appears to be losing steam. Meanwhile, the MACD shows a positive crossover of the moving averages, suggesting that the upward momentum persists, albeit with reduced strength.
On-Chain Data Signals Reduced Selling Pressure for BTC
From an on-chain perspective, the Net Realized Profit/Loss data offers additional insights. This metric shows a sharp decline in profit realization volume, signaling that investors are less inclined to sell during the recent highs. This “reset” of supply and demand dynamics indicates a period of consolidation, suggesting the market may be seeking equilibrium before determining its next direction.
Bitcoin is at a critical juncture where maintaining support above $100K is vital to avoiding a steeper reversal. The $109,500 resistance remains the key hurdle to overcome for new short-term highs.


