A long-term pattern on XRP’s price chart is capturing the attention of crypto enthusiasts, with analysts predicting a bullish breakout that could push the altcoin to $1,452.81. This projection is based on the breakout of a multi-year “bull flag” formation—a classic technical indicator often signalling the continuation of upward momentum.
As market sentiment shifts, investors are closely monitoring XRP’s price action and its potential impact on the broader crypto landscape.
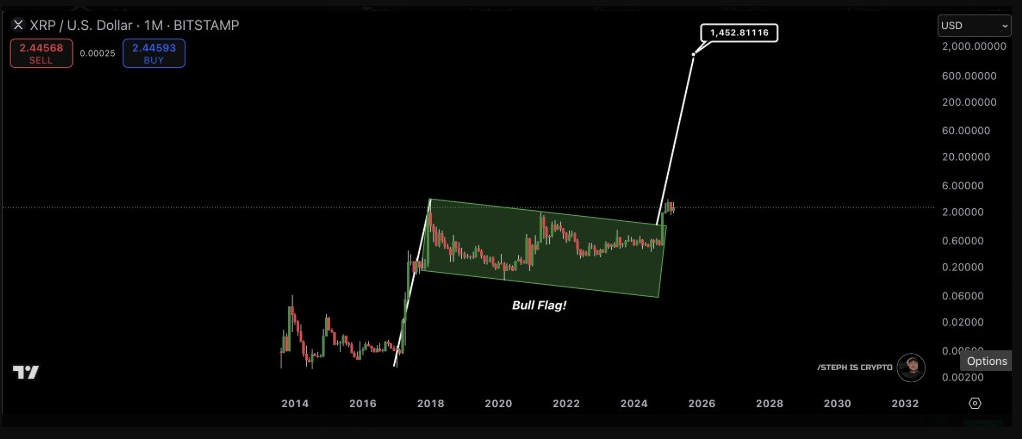
Is XRP on the Verge of a Massive Rally? Analyst Predicts $1,452 Target After Bull Flag Breakout!
Crypto analyst “Steph is Crypto” recently shared a long-term bullish outlook on XRP via the X platform. According to the analysis, XRP is breaking out of a multi-year bull flag pattern that dates back to 2018. In technical analysis, this formation typically signals the continuation of an uptrend following a period of consolidation.
The breakout above the downward-sloping channel indicates a shift in XRP’s price structure. Based on this analysis, Steph predicts XRP could reach $1,452.81 in the coming years. This forecast is derived from the initial flagpole’s length, projected from the breakout point.
Additionally, Steph’s chart suggests that XRP may now be entering a new phase of movement after years of sideways action, potentially setting the stage for significant price growth.
Sharing an optimistic outlook on Ripple’s price trajectory, the analyst asserted:
“I don’t want to give you this XRP price target! You’re definitely not bullish enough.”
Meanwhile, a recent report circulating in the media is fueling speculation that Michael Saylor might diversify his portfolio by reallocating $21 billion from Bitcoin into XRP. Analysts believe that if such a move were to happen, it could spark a massive rally, potentially driving XRP’s price toward the $1,000 milestone.
Another Key Technical Breakout Near $2.48
In a recent video update, crypto analyst “Steph is Crypto” highlighted a second technical breakout. This time, the focus was on a descending wedge pattern, a structure often associated with trend reversals. The chart showed XRP breaking above the wedge’s resistance, with the price hovering around $2.48.
According to seasoned analysts, this breakout could serve as a strategic entry point for traders. Based on the wedge’s projected target, XRP could climb to $3.36, marking an impressive 37.98% rise from its current levels.